
When the budget is cut: the cost of deferred renewal.
Parts 1 through 4 assumed an unconstrained search for the optimum. Real municipal asset management does not work that way. The investment ceiling is set by tariff politics, council priorities, and competing capital needs — not by what the network actually needs. Budget pressure is the rule, and the honest answer to “cut 20 percent” is not “we’ll defer some work.” It is a quantified curve showing what each euro cut costs in expected lifecycle NPV (Expected Lifecycle Net Present Value) , in 95th-percentile downside, and in compliance position.
The U-shape
Total 20-year lifecycle cost, plotted as a function of the annual rehabilitation budget, has a characteristic shape. Above the optimum, increasing budget produces diminishing returns — at some point you are renewing pipes that still have decades of useful life left, and the operational and failure-cost savings cannot keep up. Below the optimum, the curve turns the other way: every euro cut increases expected operational cost, expected failure cost, and expected regulator exposure by more than one euro in NPV terms. The shape is convex on both sides, but the left side typically rises faster than the right side falls.
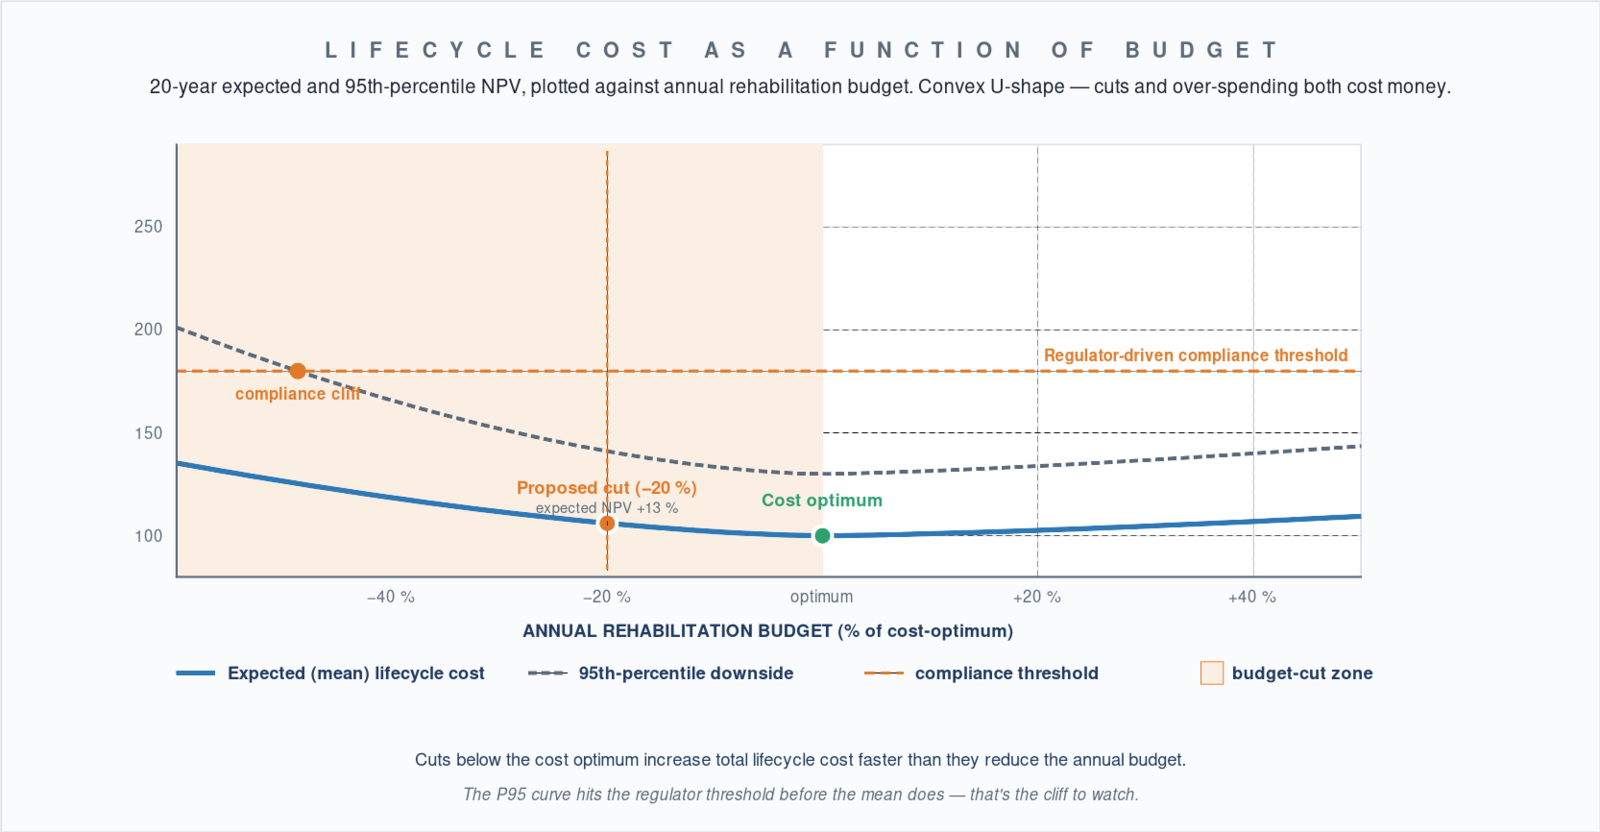
Figure 1. The mean lifecycle cost has a clear minimum at the cost optimum. The 95th-percentile downside hits the compliance threshold before the mean does — that’s the cliff to watch.
A representative Finnish mid-sized utility, run through the Monte Carlo machinery from Part 3: the cost-optimum annual budget is somewhere in the €4–6 M range. A 20 percent cut below that optimum raises expected 20-year lifecycle cost by roughly 10–15 percent. A 40 percent cut raises it by 35–60 percent, with a substantially worse 95th-percentile downside. The numbers vary with network condition, but the convex shape is universal.
Three things the curve does for you
01 · It converts a political conversation into a numerical one. Instead of “engineers always say the budget is too small” the conversation becomes “a 20 percent cut costs €1.30 in expected NPV per euro cut. A 30 percent cut costs €1.90.” The board can still choose to cut — but they cannot any longer pretend they do not know the cost.
02 · It surfaces the compliance threshold. When the 95th-percentile lifecycle cost crosses a regulator-driven floor — CSO frequency limits, water-framework-directive compliance, treatment-plant capacity — the curve doesn’t gradually deteriorate; it cliffs. Showing the cliff lets the board see exactly where “tight” becomes “non-compliant.”
03 · It quantifies the value of coordination (Part 4) under constraint. Budget cuts make the coordination prize more valuable, not less. With constrained capex, every euro that captures shared excavation cost goes further. Plans that ignored Part 4 look more expensive at any budget level; plans that built in coordination look more robust under constraint.
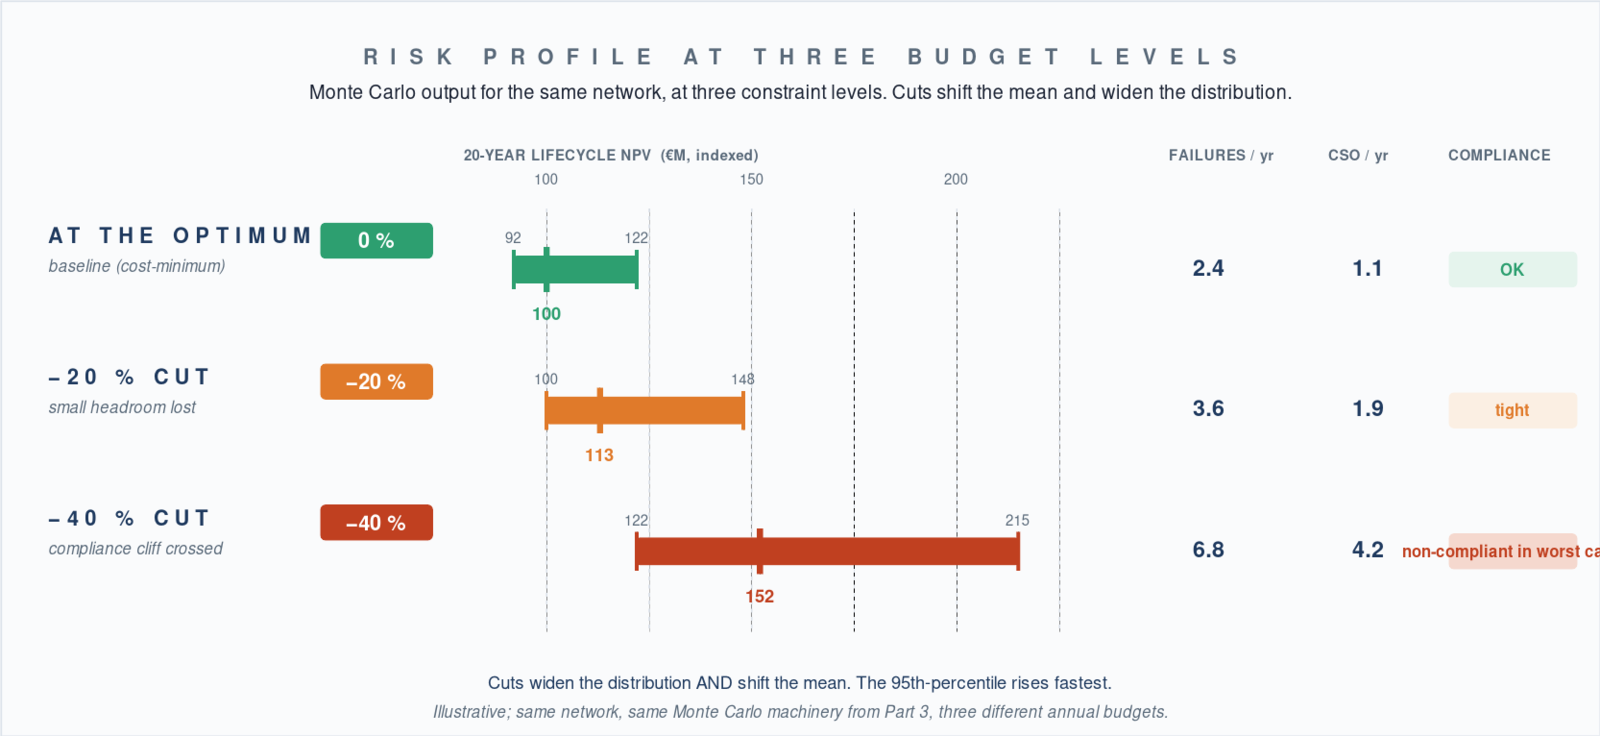
Figure 2. Risk profile at three budget levels. Cuts shift the mean and widen the distribution. The 95th-percentile rises fastest — and the compliance status flips from “OK” to “non-compliant in worst case” between the second and third row.
Robustness matters more under constraint
Under budget pressure, the right plan is rarely the cost-minimum plan. It is the most robust plan — the one whose 95th-percentile cost is smallest, even if its expected cost is slightly higher. A constrained budget cannot absorb a bad year. Two plans with the same expected cost can have very different worst cases (Part 3), and under constraint the robust choice is structurally better. Multi-objective optimisation (Part 2) makes this trade-off visible; Monte Carlo (Part 3) quantifies it.
How to present this to the board
Three slides, in this order. First: the U-shape curve, with the current budget proposal marked. Second: the marginal cost per euro cut at three plausible cut levels — a table that fits on one slide. Third: the robustness comparison — for the constrained budget, which plan has the smaller 95th-percentile downside.
The board doesn’t need to understand Monte Carlo. They need to see what cutting the budget costs, in numbers their tariff committee will recognise. The methodology earns its keep here.
Three takeaways
-
Cuts have a price. Below the cost-optimum, every euro cut costs more than one euro in expected lifecycle NPV. The shape is convex; the numbers come from Monte Carlo.
-
Compliance is a cliff, not a slope. The 95th-percentile curve hits regulator thresholds before the mean does. Show the cliff before the cut crosses it.
-
Constraint changes the choice. Under budget pressure, robustness beats cost-minimum. Pick the plan with the smaller worst case.
NEXT IN THE SERIES
Part 6 — tariffs, ROI, and the political economy of wastewater. The case for sewer asset management as a stable-tariff growth tool. The series finale.
Further reading
-
Burns, S.J. et al. (2012). Constrained capital budgeting for water utilities. Journal of Water Resources Planning and Management 138(4).
-
Cardoso, M.A. et al. (2012). Performance assessment of urban infrastructure services. Environmental Impact Assessment Review 35.
-
Halfawy, M.R., Dridi, L. & Baker, S. (2008). Integrated decision support system for optimal renewal planning of sewer networks. J. Computing in Civil Engineering 22(6).
Now in pilot. We are selecting Water utilities for the first deployments of the asset-management optimisation module — built on the US-EPA 10-step procedure and the methods discussed in this series. If you operate a network where the techniques in this post could be used, contact pasi.pajula@preventos.fi.
—
The optimisation methods in this series rely on integrated, data-quality-scored network condition data. Preventos Hero already provides that backbone in daily production use across Finnish water utilities.