Stable tariffs are growth capital: the political economy of wastewater.
- Pasi Pajula
- 5 days ago
- 4 min read

SMART SEWERS · PART 6 OF 6 · SERIES FINALE
Asset Management · 16 June 2026 · Pasi Pajula
The series opened with combinatorics, walked through cost functions and Monte Carlo, hit the operational reality of external coordination, and stopped at the budget constraint. This final part is what all of it adds up to politically. The sewer network is capital — one of the single largest physical asset on a municipality's balance sheet. Its return is realised in two forms: avoided damage and operational waste, and a stable, predictable tariff path. Tariff stability is a growth factor. Tariff spikes are a leading indicator of poor asset management.
The network is capital, and it has a return
A 30,000-segment Finnish sewer network has a replacement value somewhere in the €200–400 M range. It is not free to operate, it is not eternal, and it is not invisible on the municipal balance sheet. Like any capital asset, it has a return on investment — but that return doesn't show up as cash flow. It shows up as avoided cost: lower I/I-driven pumping and treatment, lower failure incidence, lower regulator exposure, lower property damage from surcharges, lower compliance retrofits. Multi-billion-euro infrastructure decisions are being made against an invisible balance sheet.
The methodology in Parts 1 through 5 makes that balance sheet visible. It converts deterioration models, cost functions, Monte Carlo distributions, and coordination data into a single thing a council can read: the NPV of network operation under each candidate investment programme. Once that number exists, the conversation changes shape.
Tariff stability is a growth factor
Predictable wastewater tariffs are a growth factor in their own right — for residents planning household budgets and for businesses planning capital investment. A 25 percent spike in wastewater charges, even if it produces the same revenue over five years as a smooth glide path, costs more in real economic terms: residents reduce discretionary spending, businesses postpone investment, the political cost forces the next council to under-invest again, and the spike cycle resets.

Figure 1. Same network. Roughly the same cumulative revenue over 20 years. Profoundly different economic experience for residents and businesses. The difference is asset management.
Cross-party appeal is structural. Right-leaning audiences read the same data as efficiency — the cheapest 20-year NPV path, fewer wasted euros, lower lifetime tariff burden. Left-leaning audiences read it as service continuity and tariff fairness — no shocks to low-income households, no concentrated bills, stable public services. The political economy of wastewater is unusual in this respect: the right and the left agree on the deliverable, even when they argue about its framing.
This is why the case for systematic asset management is most persuasive when it is framed as growth capital, not as engineering rigour. Sewer rehabilitation is one of the few municipal spend categories where a methodological improvement produces tariff stability AND lower lifetime cost AND better service AND better environmental compliance. The series exists to make the case.
What good asset management produces
For the council and the elected officials, the deliverables are concrete:
Lower NPV of network operation. The methodology in Parts 1–4 quantifies this directly. Typical gain on the order of 10–25 percent over a 20-year horizon for a network in average condition.
A stable tariff path. Avoiding under-investment cycles avoids the corrective spikes. The methodology produces a defensible glide path the tariff committee can commit to.
A defensible compliance position. Part 5's compliance cliff is no longer a surprise. The 95th-percentile risk profile sits inside the regulator-acceptable range with quantified margin.
Credibility on infrastructure spend. Engineering, finance, and politics use the same numbers. The conversation stops being "trust us" and starts being a shared optimisation problem.
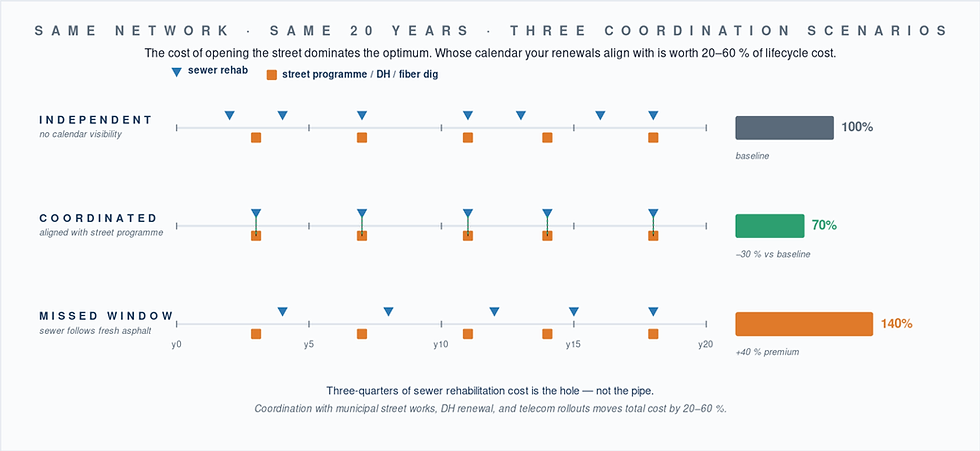
The coordination dividend. Part 4's 20–40 percent prize compounds over the planning horizon. Networks that coordinate well with the street programme, district heating, and telecom rollouts produce a structural cost advantage that competing utilities cannot match without similar discipline.
The six building blocks

Figure 2. The series in one image. All six are required. None can be skipped without weakening the others.
The pilot — and the close
Preventos is selecting Water utilities now for the first deployments of the asset-management optimisation module. The methods discussed across this series are the methods the module deploys: NSGA-II for multi-objective Pareto search, Monte Carlo for risk profiles, criticality weighting, coordination calendar integration, and budget-curve generation.
Special terms apply for early-deployment partners. If you've read this far, you are the audience the pilot was designed for. Register for pilot interest (pasi.pajula@preventos.fi · +358 45 7870 2969).
Three takeaways
01 · The network is capital. Treat it on the balance sheet, not in the engineering report.
02 · Tariff stability is growth. The economic case for asset management is cross-party. Frame accordingly.
03 · The methodology is ready. Parts 1–5 describe the operational stack. The pilot deploys it.
SERIES COMPLETE
This is the final part of the Smart sewers series. If you've followed all six, thank you. The argument is now on the table. The decision is yours — and your utility board's.
Part 1 — The decision space is unenumerable
Part 2 — The cost function unpacked
Part 3 — Monte Carlo and the risk profile
Part 4 — External coordination
Part 5 — When the budget is cut
Part 6 — Stable tariffs are growth capital (this post)
Further reading
Cardoso, M.A. et al. (2012). Performance assessment of urban infrastructure services. Environmental Impact Assessment Review 35.
Hukka, J. & Katko, T. (2003). Water privatisation revisited: Panacea or Pancake? IRC.
Burns, S.J. et al. (2012). Constrained capital budgeting for water utilities. Journal of Water Resources Planning and Management 138(4).
—
The optimisation methods in this series rely on integrated, data-quality-scored network condition data. Preventos Hero already provides that backbone in daily production use across Finnish water utilities.